The simple fact is that calendars for brands are getting busier and busier. There are now dozens of periods and sub-periods, major holidays and little celebrations for which marketers must align their activations. We want to show you just how important these key periods are for your sales; after digging into SnippCheck receipt data from three major clients in this latest “What’s In Your Basket?” installment, the impact of the calendar on brand sales becomes clear.
We analyzed a sample from our 5 million receipts for this sample of data:

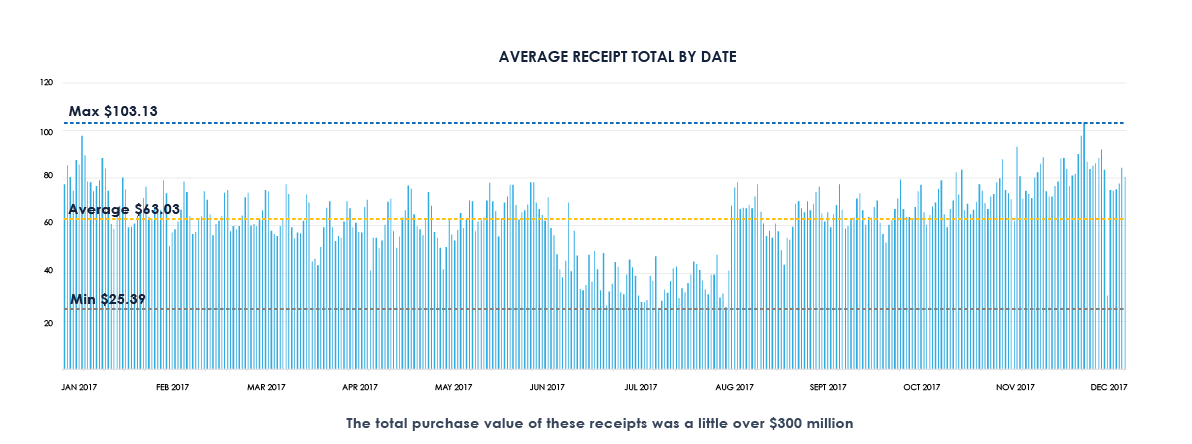
From this data, averaged out over the calendar year, we can glean:
- An average of 7,631 receipts were submitted to marketing programs run by SnippCheck, per day
- The daily average receipt total per purchase was $63.03
Of course, looking at the year in its entirety dilutes the story. Let’s examine three key holiday periods and see how sales figures correspond.
BACK-TO-SCHOOL – September 4, 2017 to September 15, 2017
During the peak back-to-school period, there is a significant bump in receipts volume as well as purchase amounts:
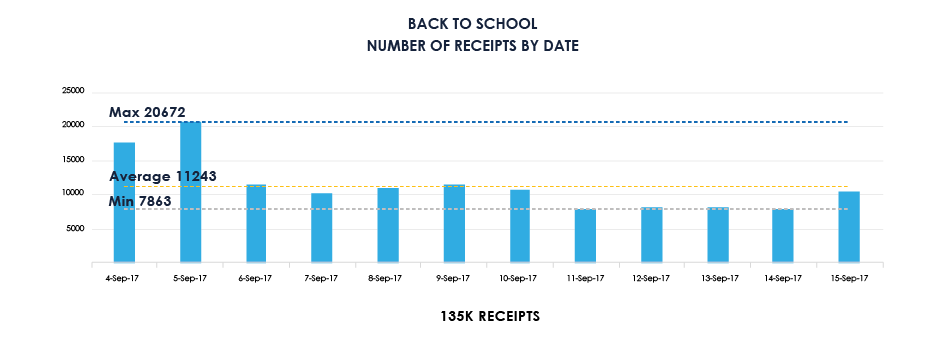
- Purchase activity is higher than average: 11,243 receipts submitted per day during the period compared to 7,631 receipts for 2017 overall.
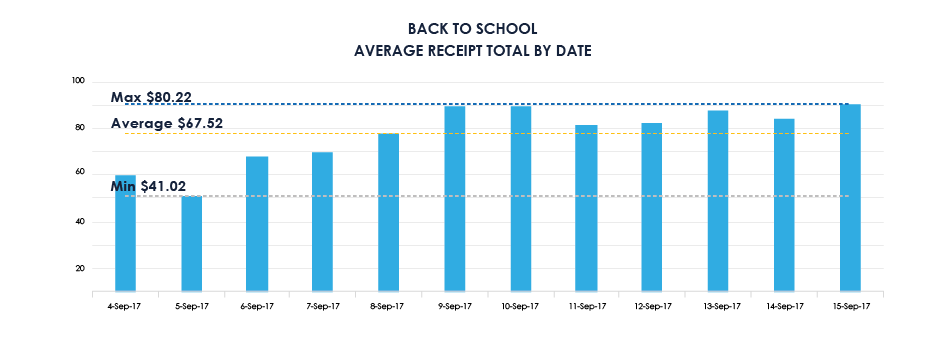
- Daily average receipt totals are also higher: $67.52 per day compared to $63.03 – a 7% increase in the amount consumers are spending.
Thanksgiving/Black Friday – November 9, 2017 to November 24, 2017
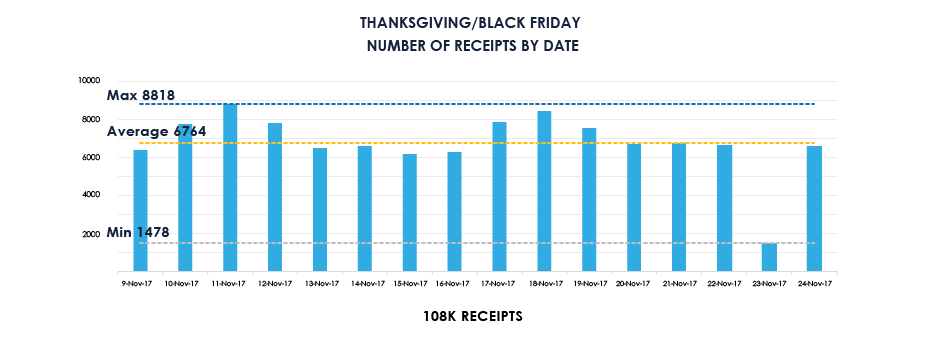
The frenzy of passionate Thanksgiving/Black Friday shoppers is well captured by SnippCheck data:
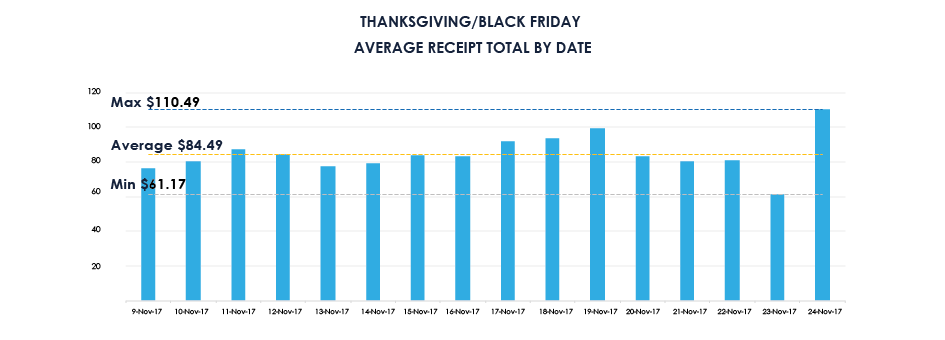
- Consumers are spending more with each purchase during this time – on average, $84.49 per receipt, a 34% increase over the year-long average of $63.03.
- Daily receipt submissions are, interestingly, less voluminous during this time – 6,764 on average, vs. 7,631
Christmas Holidays – December 1, 2017 to January 1, 2018
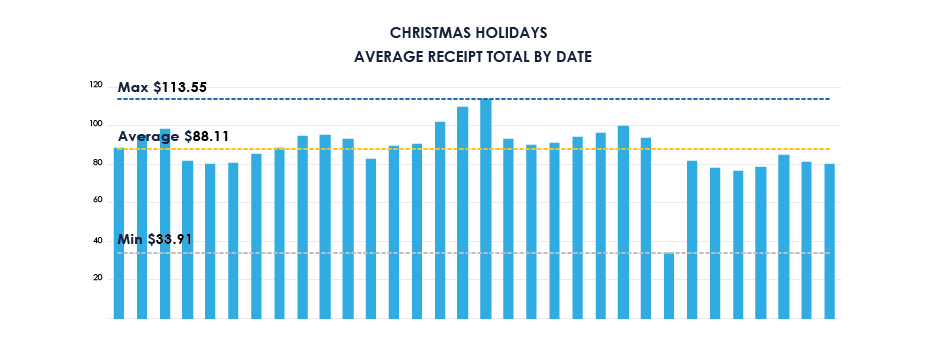
Often considered the jewel of the shopping calendar, the Christmas holidays are an enormous component of the planning periods for brands. But what does the data show?
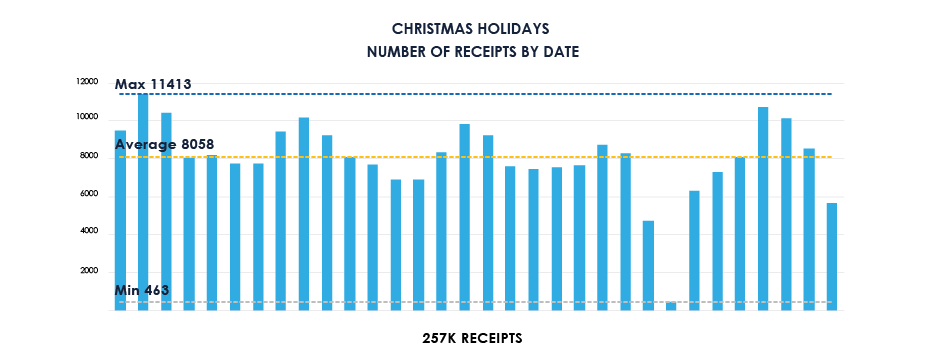
- People are making a lot of individual purchase trips: on average, there were 8,011 daily receipts submitted, a 5% increase over the yearly average
- People are spending more than ever: the dollar value for each receipt was the highest from any of the key calendar periods, at $88.11– a 40% increase over the year-long average.
Holiday Takeaway – Tips for Success
Should your strategy change depending on the time of year? Based on the data, there are a number of interpretations that could be made, but here is a handy cheat-sheet that highlights some of our thoughts:
- BACK-TO-SCHOOL: Very high receipt volume, slightly higher than average purchase spend amounts.
- Programs during the back-to-school season should be volume-oriented. Continuity programs that reward consumers for repeat shopping sessions are sure to be in-line with consumer behaviors during this key period.
- THANKSGIVING/BLACK FRIDAY: Lower than average receipt volume, substantially higher spending amounts.
- A great tactic to capitalize on this shopping pattern is by leveraging scale promotions/basket size growth programs. Consumers seem keen on making less shopping trips but spending more per trip – scale & basket size tactics such as “buy x AND y” easily and effectively reward consumers for these behaviors.
- CHRISTMAS HOLIDAYS: Higher than average receipt volume, extremely high spending amounts.
- Christmas is a must-win period for brands. Shopping has reached a fever pitch, and it can be hard to stand out amongst the competition. Christmas is an ideal time to start considering loyalty programs – consumers willingly engage with your brand during the period with a promotion or continuity incentive, but how will they continue to engage once the new year turns the corner? Growing one-time tactics into long-term loyalty will keep the wins rolling in all year long.


